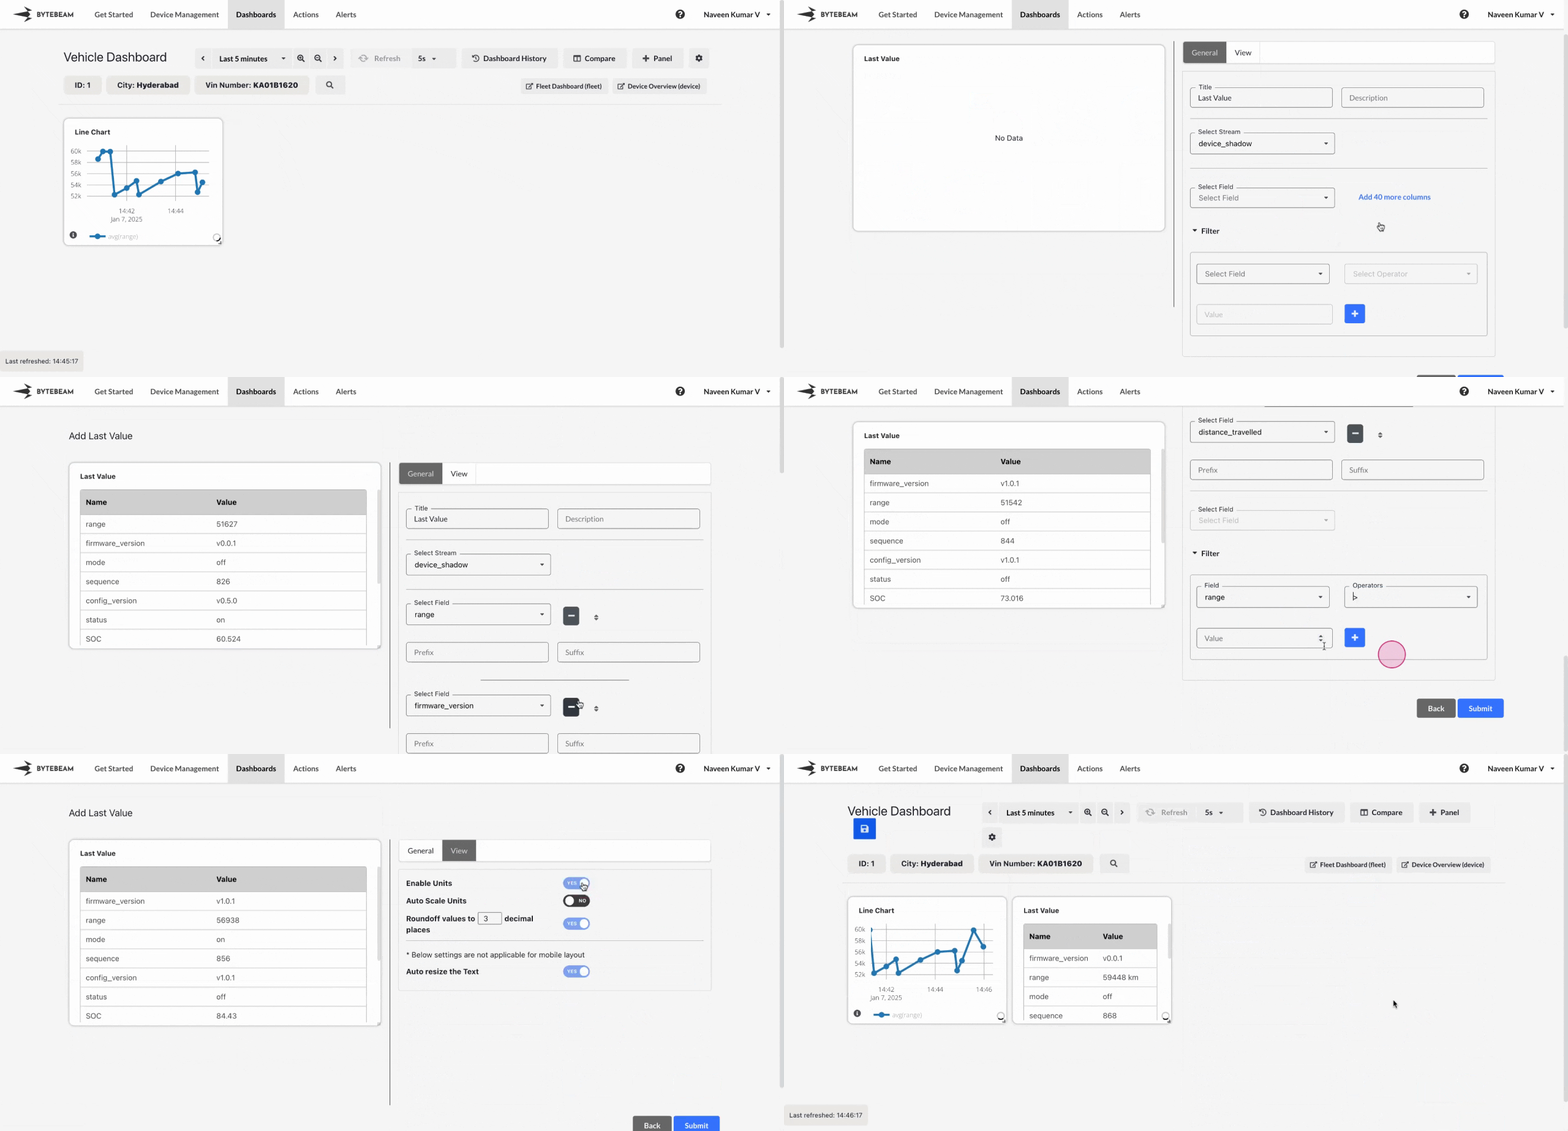
Add Last Value Panel
Navigate to Dashboards
Go to the Dashboards tab, select the desired dashboard, and click on the + Panel button to create a new panel.
Customize General Settings
Configure the following under the General Settings tab:
- Add a Title: Provide a name for the panel to represent its purpose.
- Description: Optionally, add a short description for context.
- Select Stream: Choose the data stream from which the most recent value will be displayed.
- Select Field: Pick the column (field) from which the latest value will be extracted. Choose individual columns to display or click Add 40 More Columns to include all available columns upto 40.
Apply Filters
Refine the data to be displayed using the Filters section:
- Select Field: Choose the column to apply the filter.
- Select Operator: Set the filter condition (e.g., equals, not equals, greater than).
- Enter Value: Provide the value for the selected filter.
- Click + to apply more filters as needed.
Customize View Options
Switch to the View Options tab to personalize the panel’s appearance:
- Enable Units: Display the appropriate unit for the value (e.g., °C, %, MB).
- Round Off Values: Set the number of decimal places for the displayed value.
- Auto Resize: Adjust the font size for better readability.
