- Monitoring machine or device states such as “on,” “off,” or “error.”
- Tracking operational modes like “idle,” “active,” or “maintenance.”
- Visualizing user actions or events over time.

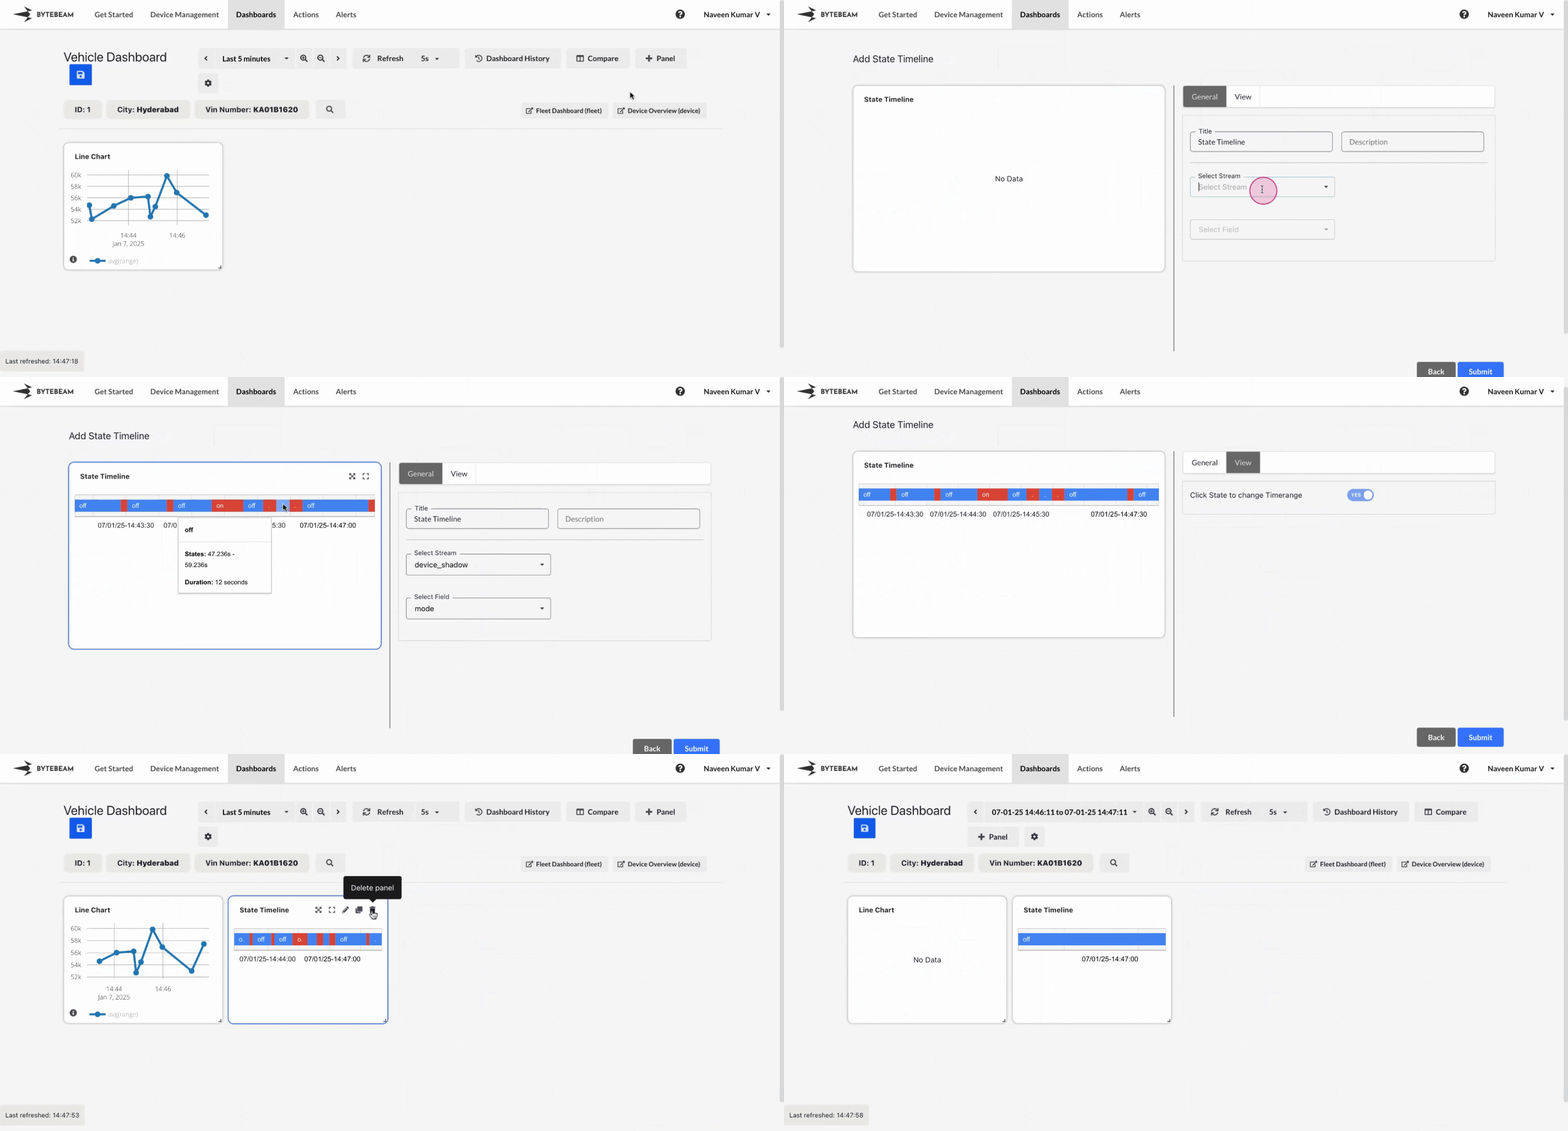
Add State Timeline Panel
Navigate to Dashboards
Go to the Dashboards tab, select the desired dashboard, and click on the + Panel button to create a new panel.
Configure General Settings
You will be presented with options to configure:
- Title: Add a descriptive title for the panel.
- Stream: Select the data stream to visualize.
- Field: Choose the field or column that represents the states.
Customize View Settings
Switch to the View tab to adjust the behavior and appearance of the timeline:
- Enable ‘Click State to Change Timerange’: When enabled, clicking on any point in the State Timeline panel will adjust the dashboard’s timerange to the corresponding time period.