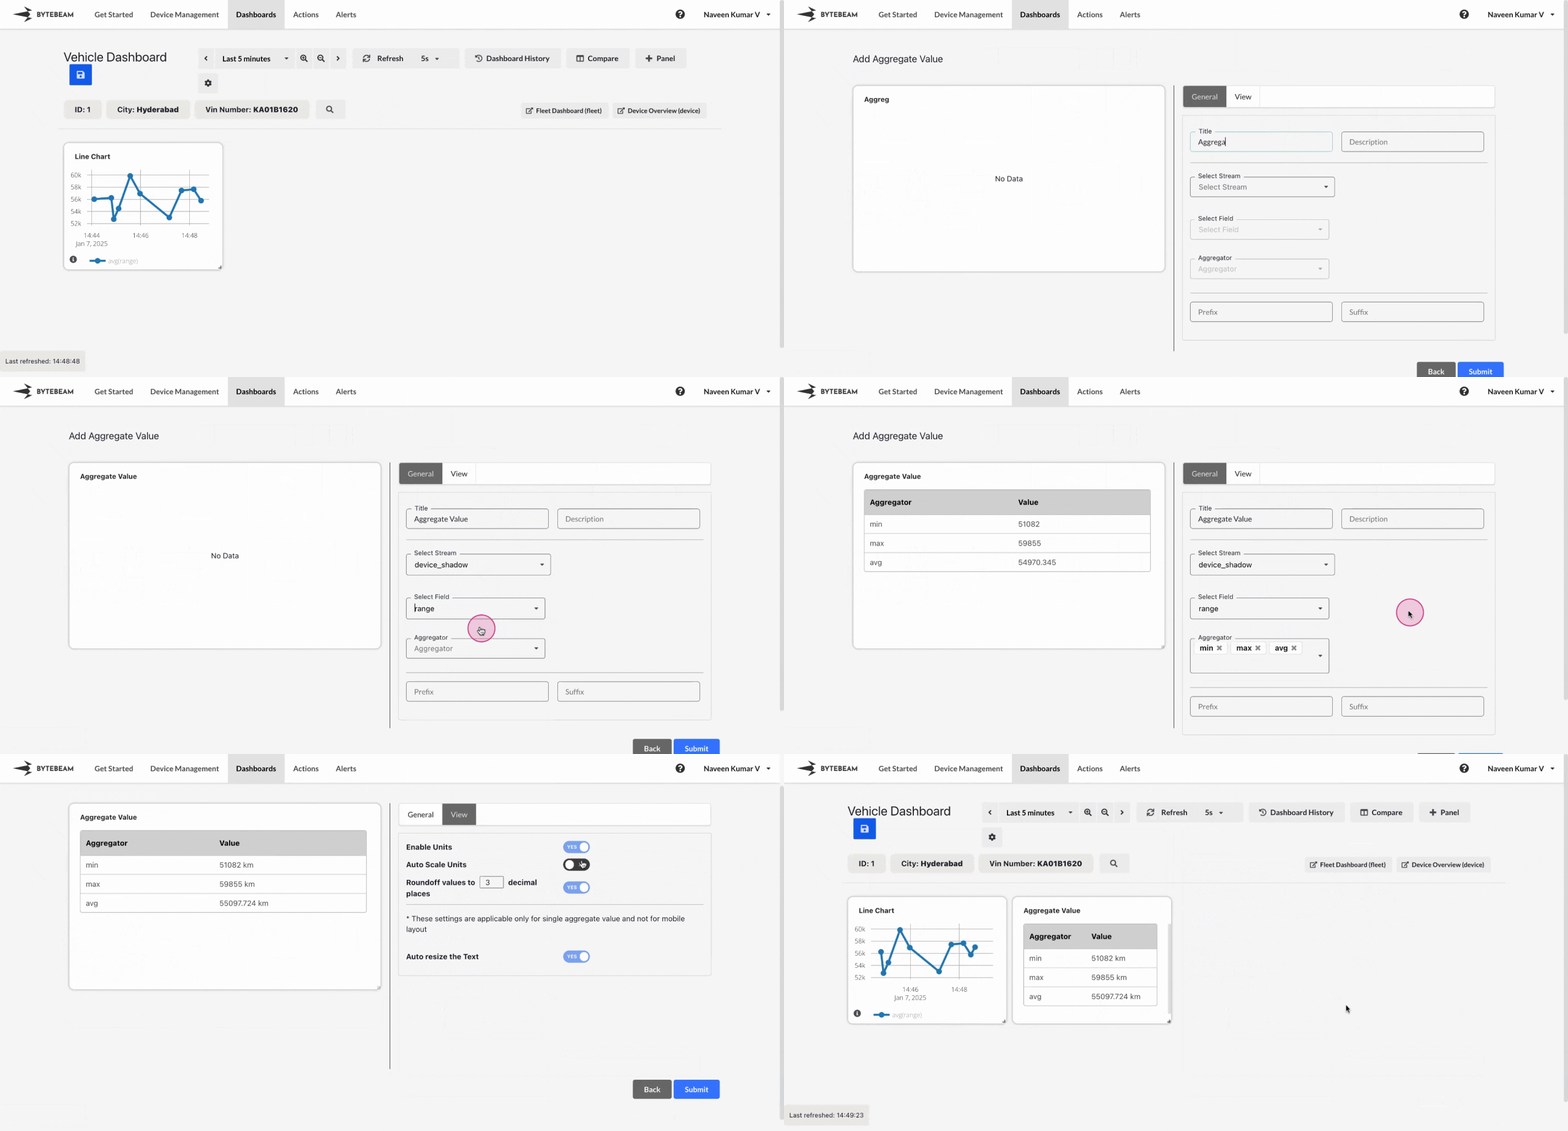
Add Aggregate Value Panel
1
Navigate to Dashboards
Go to the Dashboards tab, select the desired dashboard, and click on the + Panel button to create a new panel.
2
Select Aggregate Value Panel
Choose Aggregate Value Panel from the list of available panels.
3
Configure General Settings
You will be presented with options to configure:
- Title: Add a meaningful title for the panel.
- Stream: Select the stream or data source to pull values from.
- Field: Select the field or column to apply aggregation to.
- Aggregator: Choose the aggregation type (max, min, avg, sum, count, count distinct).
- Second Aggregator: Choose the second aggregation type
- Enable Groupby on Second Aggregator: Enable the toggle for grouping on second aggregator
- Prefix and Suffix: Optionally, add prefixes and suffixes to enhance the display.
On selecting an aggregator (e.g., min) and a second aggregator (e.g., max), it creates combinations like max(min). With the Group by Second Aggregator toggle enabled, the grouping operation is applied to the secondary aggregator.Both second aggregator and the toggle to group by on second aggregator are available exclusively for fleet dashboards
4
Customize View Settings
Switch to the View tab to adjust the appearance of the panel:
- Enable Units: Show appropriate units for the aggregate value.
- Round Off Values: Set the number of decimal places to display.
- Auto Resize Text: Automatically adjust font size for better readability.
5
Submit the Panel
After completing the configurations and customizations, click Submit to add the Aggregate Panel to the dashboard.