Add Logs Panel
Navigate to Dashboards
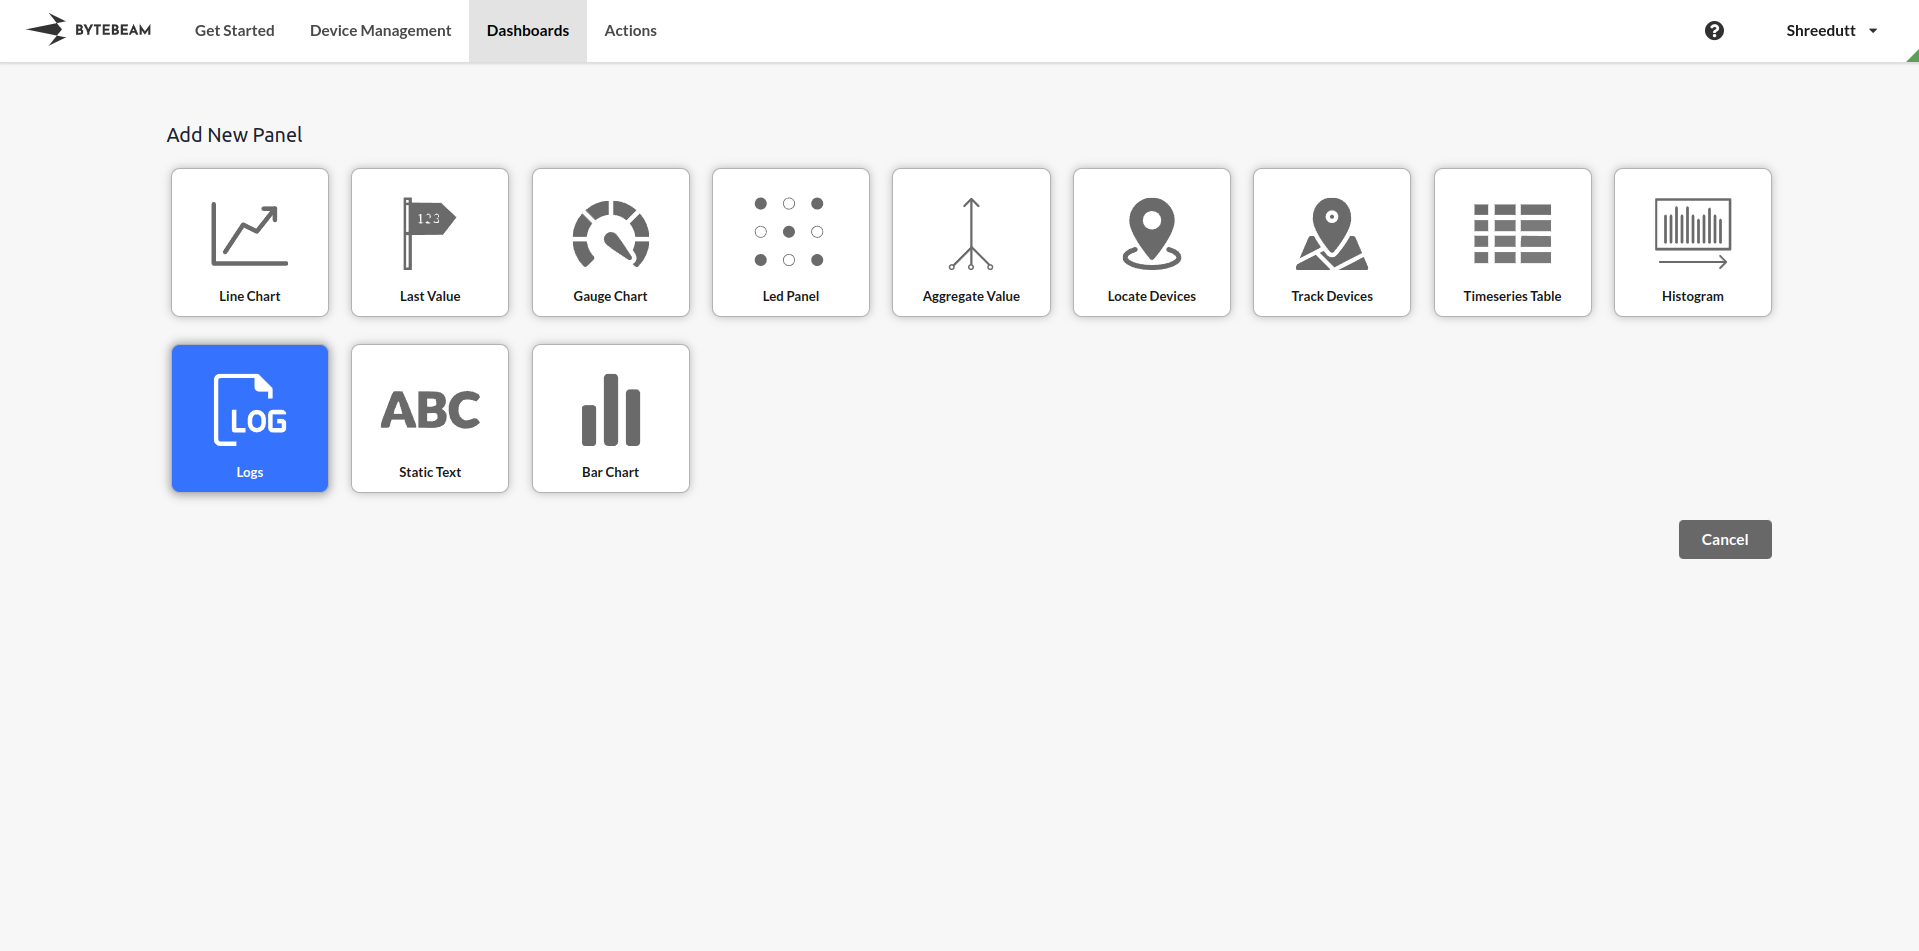
Go to the Dashboards tab, select the desired dashboard, and click on the + Panel button to create a new panel.
Configure General Settings
In the General tab: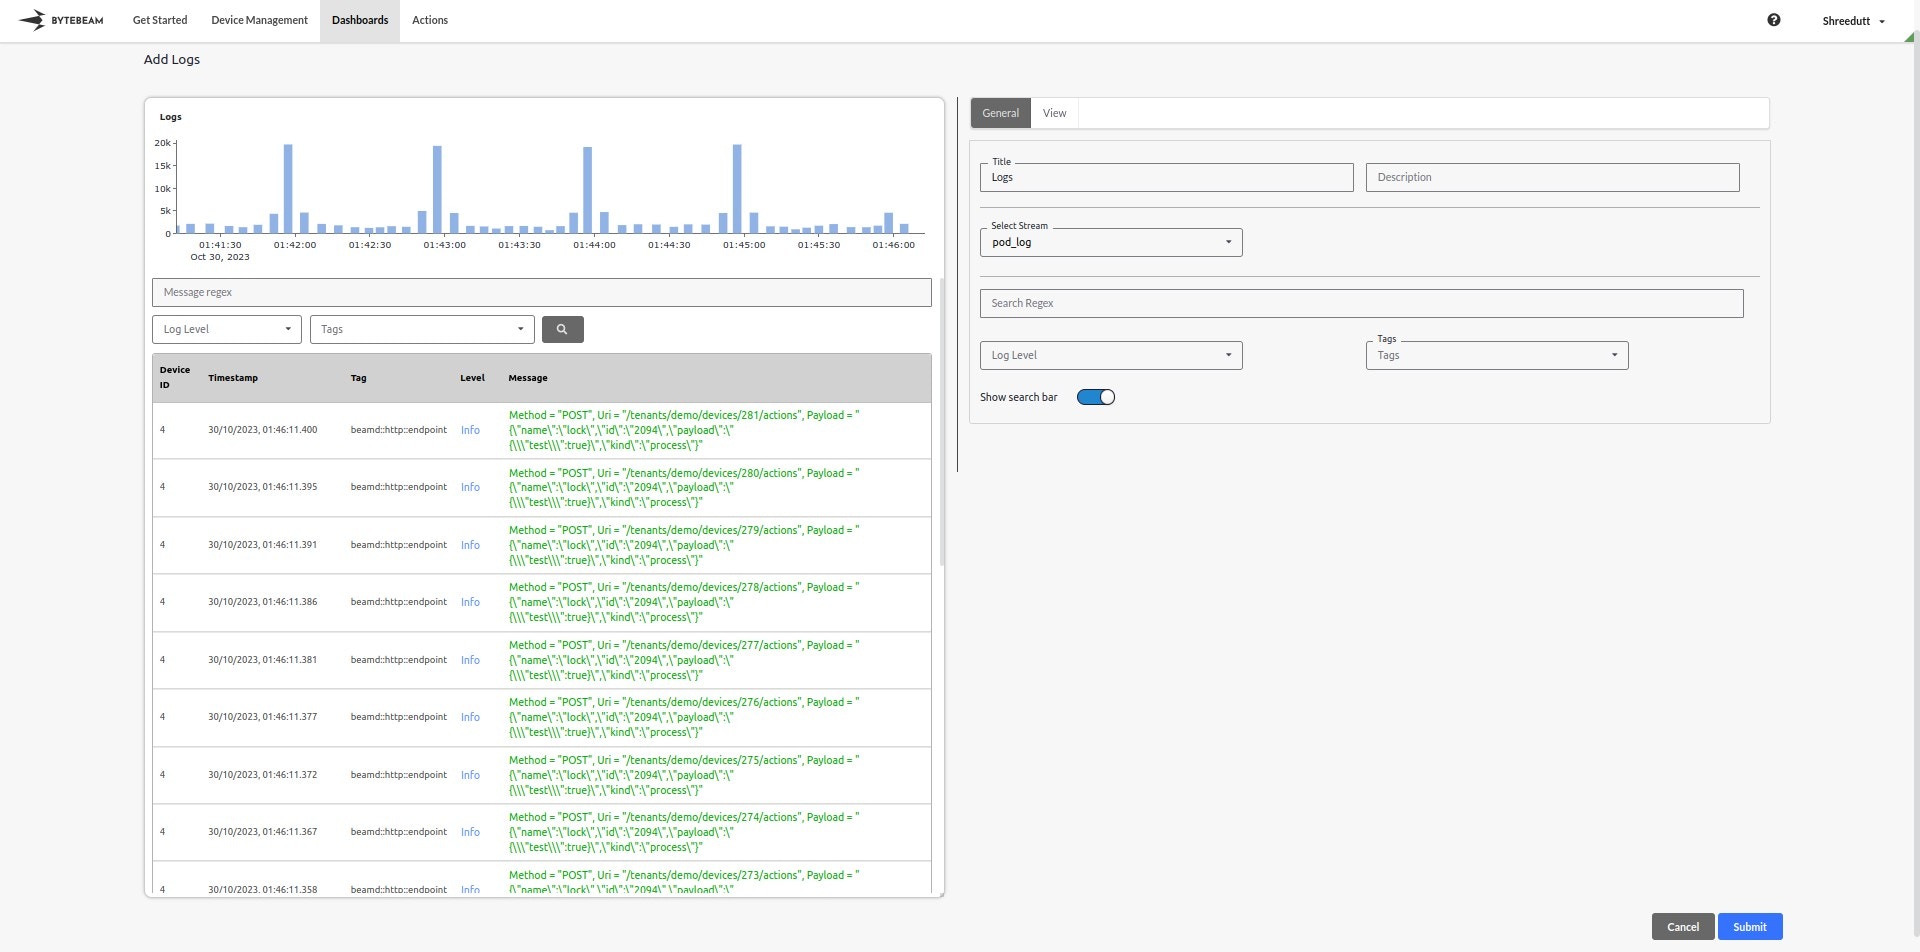
- Title: Add a descriptive title for the panel (optional).
- Stream: Select the data stream containing log information.
- Search Bar: Enable the search bar option to search with a regular expression.
- When enabled, the search regex, log level, tags, and search icon will appear in the preview panel.
- Search Regex: Enter a regex pattern to filter messages.
- Log Level: Specify a log level (e.g., info, warning, error).
- Tags: Select or enter tags to further filter the logs.
Customize View Settings
Switch to the View tab to adjust the graph settings:
-
Number of Bins: Adjust the slider to define the number of bins for the histogram of log events.
