💡 Explore Our Latest Features Take a deep dive into our new features! Have questions? Request a Demo for a personalized walkthrough.Documentation Index
Fetch the complete documentation index at: https://bytebeam.io/docs/llms.txt
Use this file to discover all available pages before exploring further.
Important Update
The documentation has been updated! Check out the Beta Version and share your valuable feedback.
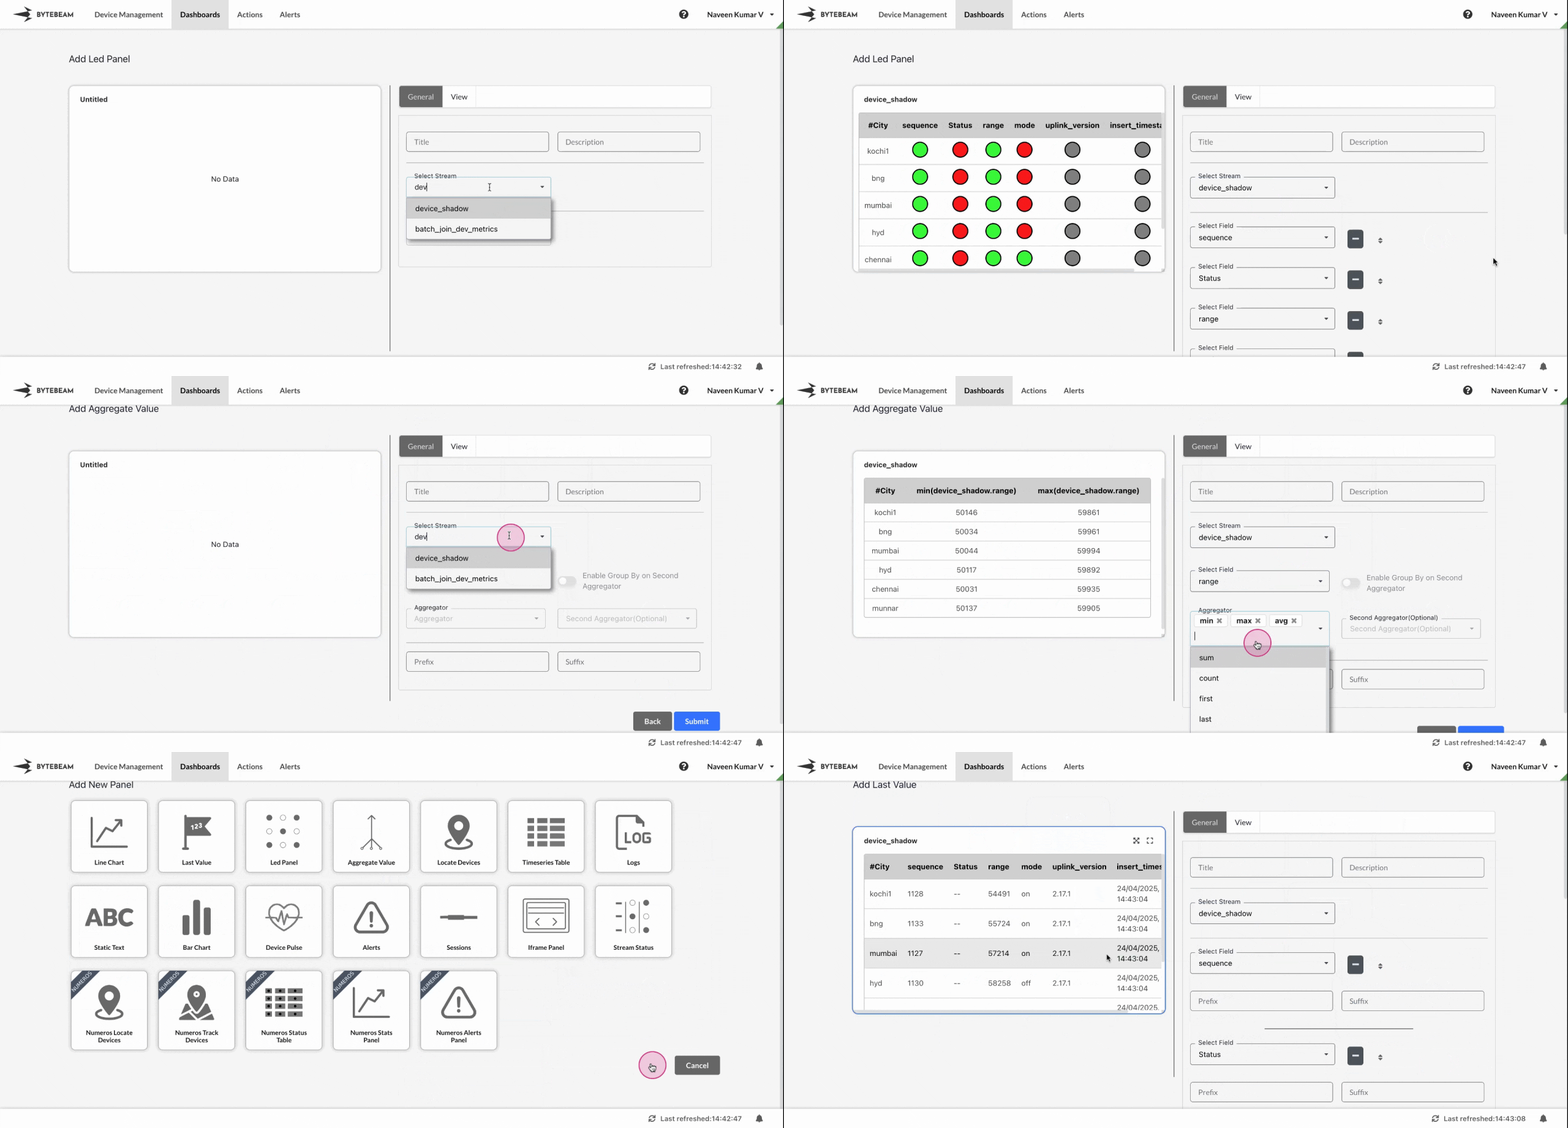
Table View as Default in Fleet Dashboard
 We have introduced the tabular view as default for LED, Aggregate Value and Last Value panels in the Fleet Dashboard. Users can now select specific columns in each of the above panels. The first column will display Device IDs or metadata keys, followed by the columns you’ve selected for that panel.
With all the selected information visible for all devices at once, users can quickly compare and identify patterns or anomalies across the fleet.
Warning Modal for Devices with Ongoing Actions
 We have implemented a warning modal which will be displayed when users attempt to trigger an action from Device Management on devices with ongoing actions. Users have two options:
- Complete existing actions and proceed – This will mark any pending actions on the platform as complete before proceeding and triggers the action.
- Proceed anyway with new action – This will trigger the new action. If the action is scheduled for immediate and device is already busy, the action will enter the Queued state.
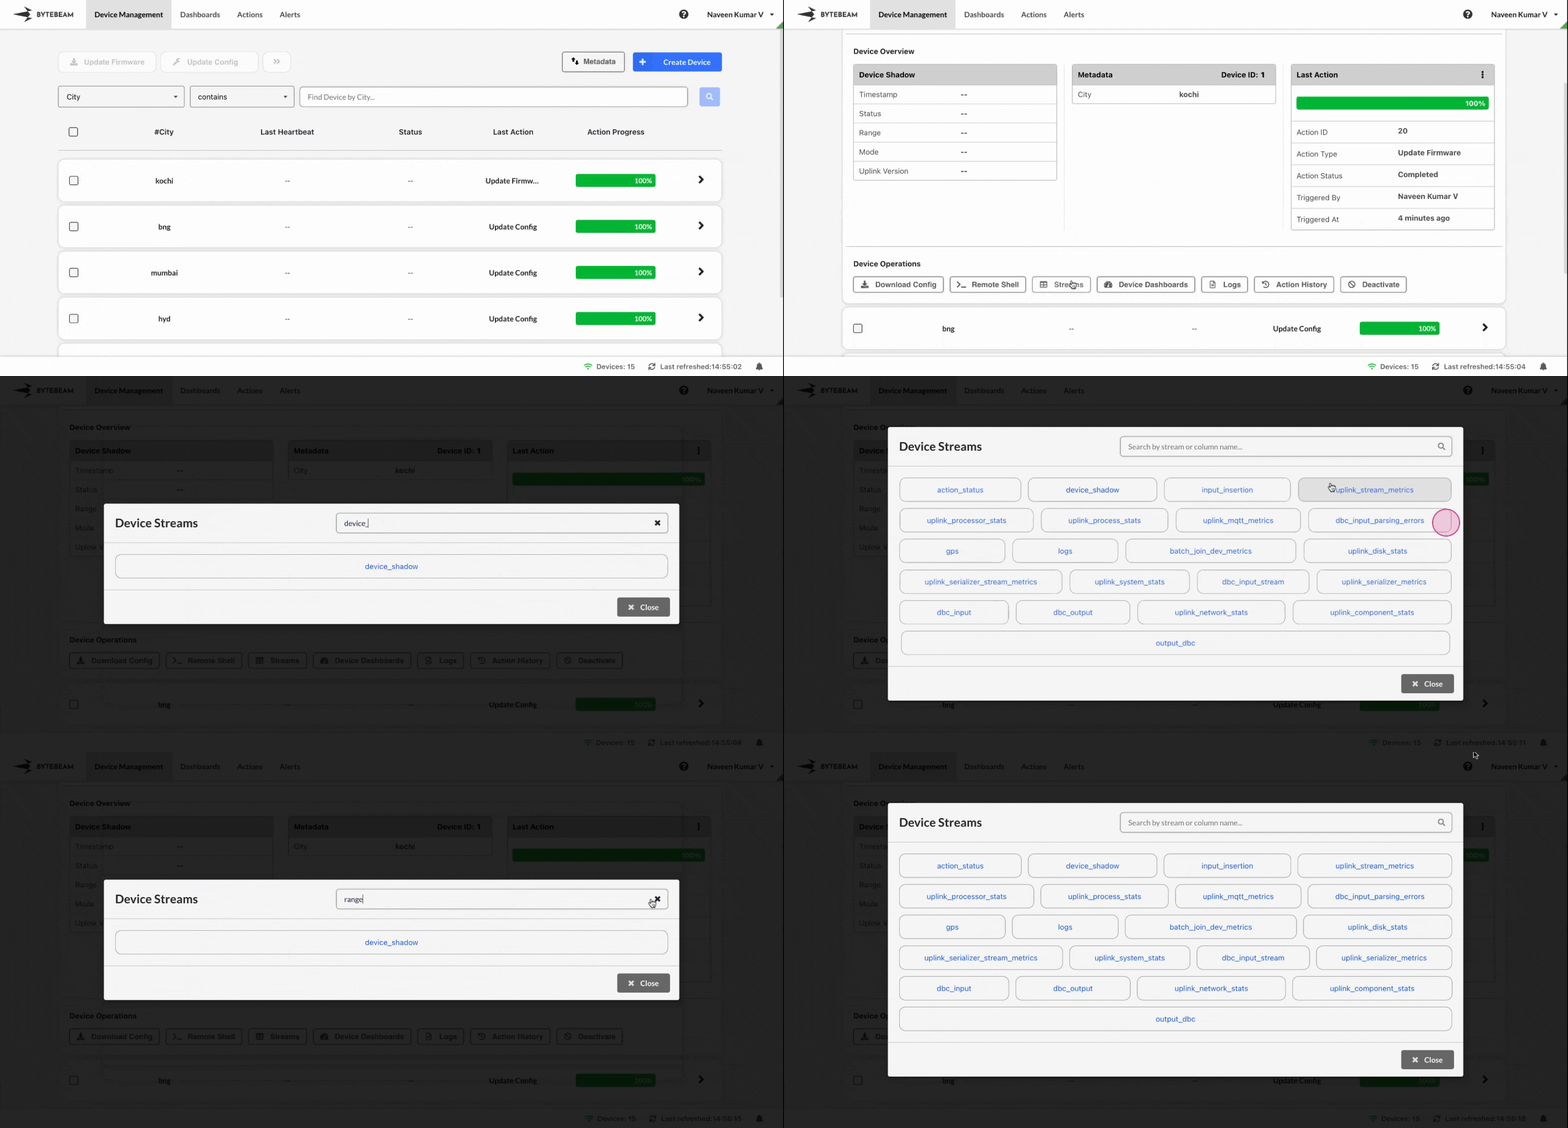
Search bar in Streams modal
 We have added the search bar to the Devices/Streams modal, allowing users to quickly find specific streams by stream name or associated column names.
This enhancement is especially useful when dealing with a large number of streams, making it easier to locate and view the desired stream data with just a click.
Bug Fixes & Minor Improvements
- Improved Project Selection: The “Select another project” hyperlink has been replaced with a more prominent call-to-action button named “Switch Project” for better visibility.
- Mobile Access to Alerts Dashboard: The Alerts Dashboard is now accessible from the mobile navigation bar for improved usability on smaller screens.
- Boolean Dropdown in Alert Rule Modals: Columns with boolean data types now display a dropdown with true/false options in the Create/Edit Alert Rule modals for easier rule configuration.
- Last Refresh Timestamp: The Alerts Dashboard now shows the last refresh time in the status bar, giving users clearer visibility into data freshness.
Want to better understand how these features work for you? Request a Demo and schedule a personalized session with our team.